top of page

Water filtration in Esquimalt

Love the water.
Every day.

Better-tasting drinking water. Less disinfectant taste and odour throughout your home. Let’s build the right system for your water.

Call LiveSmart: 778-477-6660

On a private well? Start here →

Greater Victoria water supplyRegional information for municipal customers.
Chloramine disinfectionChoose carbon designed for chloramine.
Very soft · about 1 GPGYour own water test confirms the right fit.

Our recommended combination

One system for the home.
One for the water you drink.

Start with CarbonShield for whole-home filtration. Add HydroPure RO for drinking water you’ll look forward to pouring.

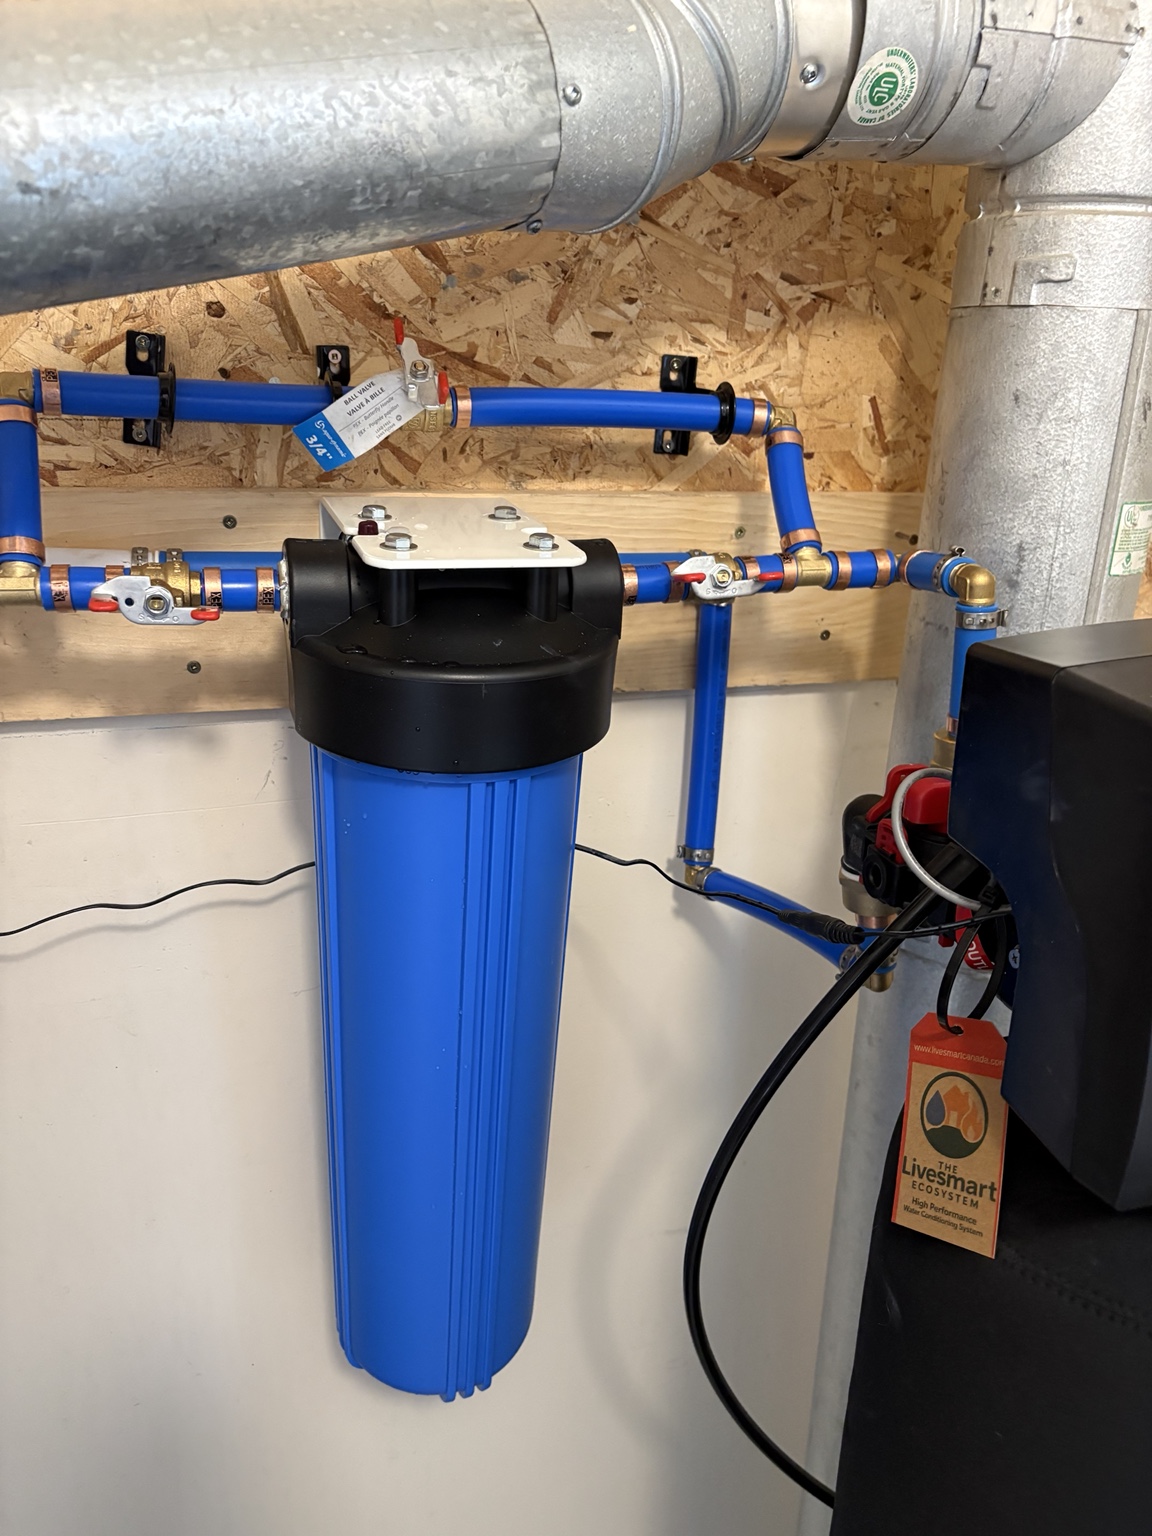
A LiveSmart whole-home treatment installation with a blue prefilter and plumbing beside a black treatment tank
A real LiveSmart installation

CarbonShield · Whole-home carbon

Less disinfectant taste and odour.

Esquimalt’s municipal supply uses chloramine. We select a catalytic-carbon configuration and size it for your household’s water flow.

  • Treat water as it enters your home.
  • Serve kitchen, bathroom and laundry taps.
  • Get a clear plan for media changes and service.
Talk to us about CarbonShield Explore our carbon filters →
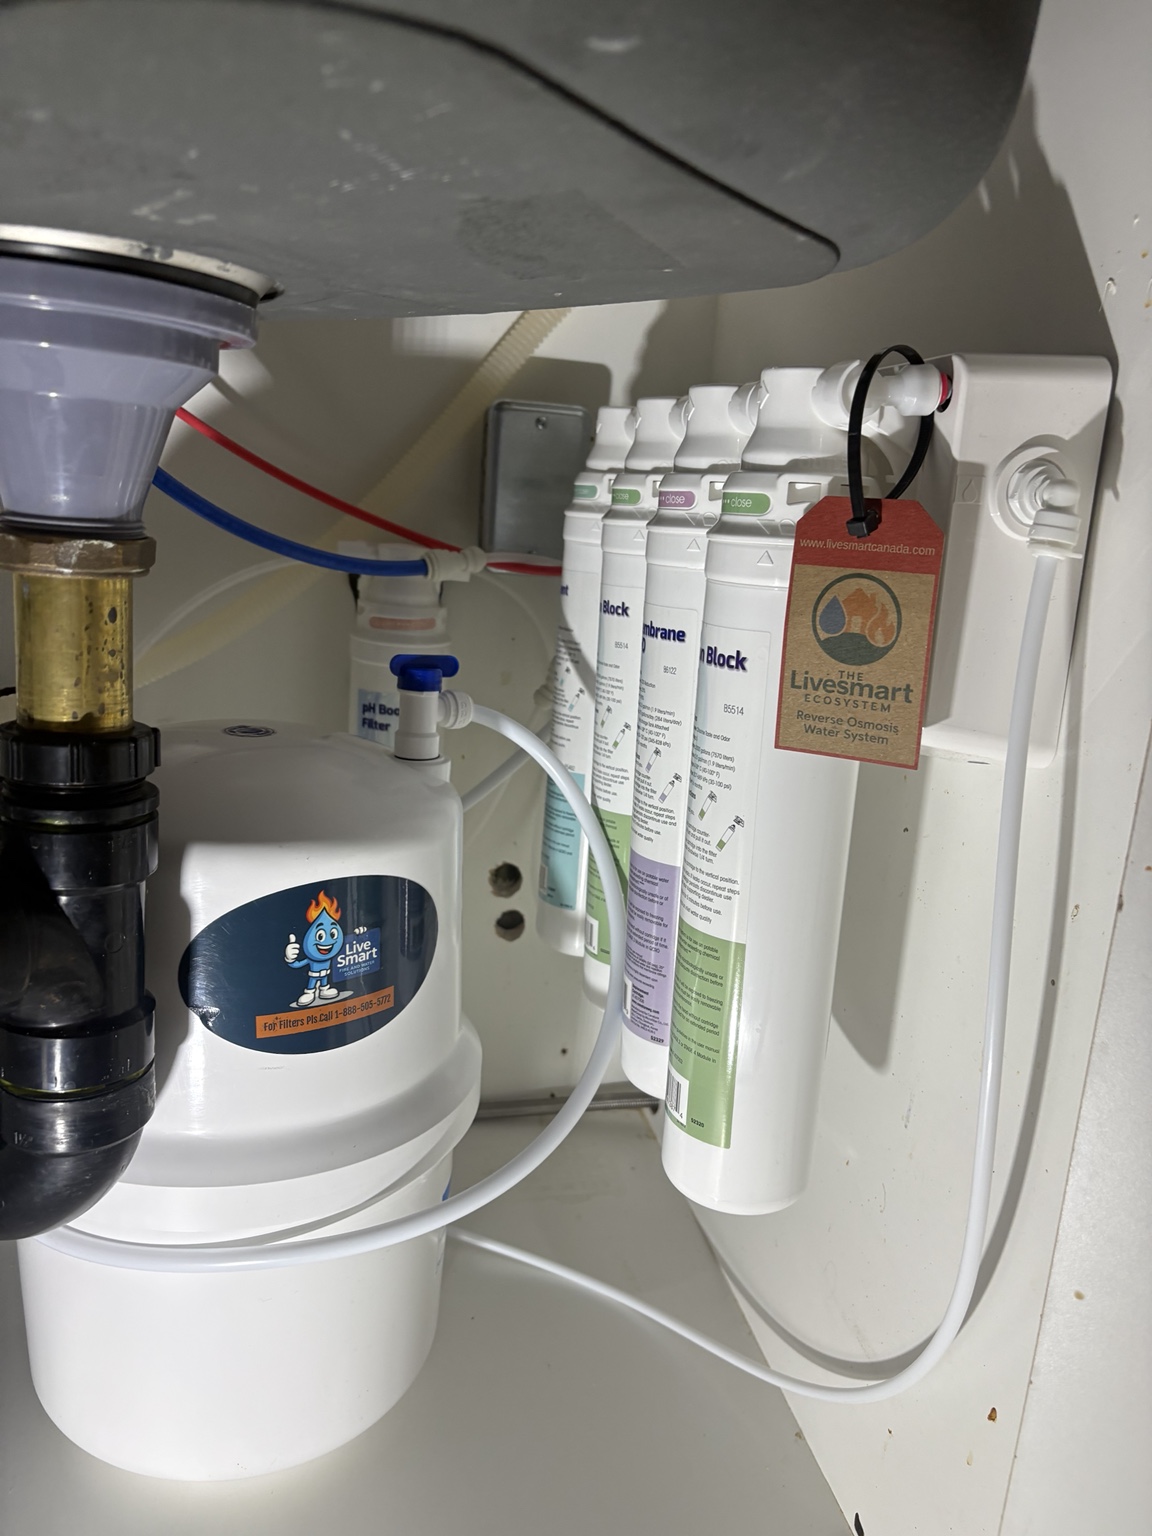
LiveSmart drinking-water filter cartridges and a white RO storage tank installed beneath a kitchen sink
A real LiveSmart installation

HydroPure · Reverse osmosis

A fresh pour, right at home.

HydroPure adds a dedicated drinking-water tap and reduces dissolved substances that whole-home carbon alone doesn’t address.

  • Filtered water for drinking, cooking and coffee.
  • Refill your water bottle at the kitchen sink.
  • Want minerals added back? Ask about remineralization.
Talk to us about HydroPure RO Explore our RO systems →

Do you have well water?

Start with a water test.

Well water can have hardness, iron, sediment or a sulphur smell. Every well is different.

Let’s test your water, talk about what’s bothering you and recommend a system based on your results.

Have a lab report? We can review it with you. Bacteria and other health-related concerns need laboratory testing; we’ll explain what to arrange.

Scale or hard-water spots?

We’ll measure hardness and see whether a softener fits.

Rust stains or discoloured water?

We’ll check for iron, manganese and sediment.

A rotten-egg smell?

We’ll investigate the source before choosing odour treatment.

Concerns about drinking water?

We’ll review the testing needed and your filtration options.

Make the next step easy

A clear plan for your water.

01 · Tell us what you notice

Taste, smell, stains or scale?

We’ll start with your water source and what you want to improve.

02 · Check your water

Get a recommendation that fits.

We’ll assess the water, review available results and size the equipment for your home.

03 · Know what you’re choosing

Understand the system and cost.

We’ll explain the installation, price and maintenance before you decide.

LiveSmart support continues after installation.

Our Friends for Life journey includes equipment records, My Water Passport and help planning filter changes and service.

See more real installations →

A few useful answers

Which system is right for you?

Why recommend carbon and RO together?

They do different jobs. Whole-home carbon targets disinfectant taste and odour throughout the house. RO adds finer treatment for the water you drink and cook with. We can quote each option separately or as a combined plan.

Does Esquimalt municipal water need a softener?

The regional municipal supply is very soft, at about 1 grain per gallon. Carbon filtration and drinking-water RO are our starting recommendations here. If your own test shows hard water, we’ll assess a softener—whether your water comes from a municipality or a well.

Can I have RO water with minerals added back?

Yes. Ask us to include a suitable remineralization stage in your drinking-water setup. We’ll explain the minerals it adds and how it affects taste and pH.

Is this saying municipal water is unsafe?

No. Esquimalt receives treated, monitored municipal water. These recommendations focus on your preferences for taste, odour and drinking-water filtration. A specific water concern calls for appropriate testing and a system chosen for that result.

Want the numbers? View Esquimalt’s water results and sources.

These are regional municipal results, not a test of a private well or your individual tap. Hardness is shown in both mg/L and grains per gallon (GPG).

Hardness in grains per gallon.

Conversions of the published hardness results retained on this page. Each row keeps its sample or supply context; these are not additional tests or a single current community average.

View hardness results in GPG
Sample / source contextSample dateHardness (mg/L as CaCO₃)Hardness (GPG)
2025 median · CRD Goldstream treated-water results · 2025See the dated source table below18.11.1 GPG
2025 minimum · CRD Goldstream treated-water results · 2025See the dated source table below160.9 GPG
2025 maximum · CRD Goldstream treated-water results · 2025See the dated source table below18.51.1 GPG
2015–2024 median · CRD Goldstream treated-water results · 2025See the dated source table below16.91.0 GPG
2015–2024 range · CRD Goldstream treated-water results · 2025See the dated source table below12-22.10.7-1.3 GPG

1 grain per US gallon = 17.118 mg/L as CaCO₃. Original laboratory units, dates, and source links remain with the water results below.

Local water information

Published water results
for Esquimalt.

Esquimalt’s distribution results are reported together with Victoria.

Victoria / Esquimalt · Annual physical and chemical results

2025

Victoria / Esquimalt distribution-system results. Shared-system figures apply to the named network, not every property in Esquimalt.

Victoria / Esquimalt · Distribution medians
ParameterUnit2025 median
Chlorine residualmg/L as Cl₂1.67
pHpH units7.8
Alkalinitymg/L18.20
TurbidityNTU0.25
Conductivity (25ºC)µS/cm57.510
ColourTCU5.0

Annual and monthly medians are summaries of sampled values, not a guarantee at an individual tap.

CRD · 2025 annual report ↗
Victoria / Esquimalt · Monthly monitoring

2025

Victoria / Esquimalt distribution-system results. Shared-system figures apply to the named network, not every property in Esquimalt.

Victoria / Esquimalt · 2025 monthly monitoring
MonthBacteria samplesTotal coliform >0Percent >0Positive resamplesTotal coliform >10E. coli >0Turbidity samplesTurbidity >1 NTUChlorine median (mg/L as Cl₂)Temperature median (°C)
JAN10500000911.767.7
FEB9600000701.736.3
MAR9900000701.78.2
APR11300000701.6711.2
MAY9800000701.6213.8
JUN9600000801.6716.9
JUL11600000801.7219.2
AUG9800000601.7121
SEP10600000701.6320.2
OCT10111001401.6215.9
NOV9500000501.5711.9
DEC9600000501.6410.1
Total:121910.10018011.6713

Bacterial concentrations use CFU/100 mL; counts in the table are numbers of samples. Total is the source’s annual summary row. See the report for follow-up investigations and corrective actions.

CRD · 2025 annual report ↗
Goldstream · Treated water after the plant

2025 analytical results; historical comparison covers 2015–2024

CRD treated-water results after the Goldstream Water Treatment Plant. These are plant-outlet statistics for the regional supply, not samples from every neighbourhood or home. The 2025 results and the historical 2015–2024 statistics are labelled separately.

CRD Goldstream treated-water results · 2025
ParameterUnit2025 median2025 samples2025 minimum2025 maximum2015–2024 median2015–2024 samples2015–2024 range
Alkalinity, Totalmg/L17.91116.718.914.71467.16-23
Carbon, Dissolved Organicmg/L1.9111.82.21.8110< 0.5-370
Carbon, Total Organicmg/L1.9111.62.51.801130.93 - 4.99
Colour, TrueTCU553283.8509< 1.4-17
Conductivity @ 25 CµS/cm56.25328.763.747.750831.1-98.6
Hardness as CaCO3mg/L18.1121618.516.914012-22.1
OdourOdour Profile12441112,3201-1
pHpH units7.6517.088.417.225376.54-8.33
TasteFlavour Profile12211112,3081-1
Total Dissolved Solidsmg/L3611<106030113<10-78
Total Suspended Solidsmg/L< 111< 11.6< 1112< 1-6
Total Solidsmg/L4411307034109< 1-110
Turbidity, Grab SamplesNTU0.252450.150.90.282,3950.1-6.3
Water Temp., Grab Samplesdegrees C10.32453.520.210.22,4082.5-21.1
Bromatemg/L as BrO3< 0.009511< 0.0095< 0.0095< 0.009541< 0.0095-0.011
Bromideµg/L as Br0.05640.0250.178< 0.01371.8e-005-0.046
Chloridemg/L as Cl4.133.84.94.3311-< 10
Chlorate, dissolvedmg/L as ClO2< 0.111< 0.10.18< 0.149< 0.1-0.38
Chlorite, dissolvedmg/L as ClO3<0.19.00<0.1<0.1< 0.110< 0.1-< 0.1
Cyanidemg/L as Cn< 0.00054< 0.00050.00052< 0.000532< 0.0005-0.00554
Fluoridemg/L as F< 0.054< 0.05< 0.05< 0.0534< 0.02-< 0.05
Nitrate, Dissolvedµg/L as N< 2011< 2028< 20118< 0.02-46
Nitrite, Dissolvedµg/L as N< 511< 5< 5< 5118< 5-5
Nitrate + Nitriteµg/L as N< 2011< 2028< 20118< 20-46
Nitrogen, Ammoniaµg/L as N270112203102301130.11-760
Nitrogen, Total Kjeldahlµg/L as N4231133788438111174-950
Nitrogen, Totalµg/L as N42911337884389113104-976
Phosphate, Ortho, Dissolvedµg/L as P< 111< 14< 3112< 1-6.2
Phosphate, Total, Dissolvedµg/L as P211< 12.92.7113< 1-< 30
Phosphate, Totalµg/L as P2.8111.64.32.70113<1 - 14
Silicamg/L as SiO24.6114.24.94.21092.91-5.5
Siliconµg/L as Si2,030121,7502,2001,9901151400-2740
Sulphatemg/L as SO41.111< 11.41.31110.8-< 10
Sulphidemg/L as H2S< 0.001811< 0.0018< 0.0018< 0.001846< 0.0018-0.027
Sulphurmg/L as S< 312< 3< 3< 3115< 3-< 3
Aluminumµg/L as Al12.65124.350.615.71153.6-67.7
Antimonyµg/L as Sb< 0.512< 0.5< 0.5< 0.5115< 0.02-< 0.5
Arsenicµg/L as As< 0.112< 0.10.12< 0.11150.04-0.17
Bariumµg/L as Ba3.7122.84.13.711153.3-4.8
Berylliumµg/L as Be< 0.112< 0.1< 0.1< 0.1114< 0.01-< 0.1
Bismuthµg/L as Bi< 112< 1< 1< 1115< 0.005-< 1
Boronµg/L as B< 5012< 50< 50< 50115< 10-50
Cadmiumµg/L as Cd< 0.0112< 0.01< 0.01< 0.01115< 0.005-< 0.1
Calciummg/L as Ca5.105123.685.434.851154.18-6.82
Chromiumµg/L as Cr< 112< 1< 1< 1115< 0.1-1.2
Cobaltµg/L as Co< 0.212< 0.20.21< 0.21150.023-< 0.5
Copperµg/L as Cu1.445121.13.726.281151.03-202
Ironµg/L as Fe27.451210.73212211510.4-198
Leadµg/L as Pb< 0.212< 0.20.24< 0.21150.017-1.94
Lithiumµg/L as Li< 212< 2< 2< 277< 0.5-13.5
Magnesiummg/L as Mg1.165121.052.161.131150.146-1.34
Manganeseµg/L as Mn7.85121.864.24.51151.3-51.1
Mercury, Totalµg/L as Hg< 0.001911< 0.00190.0021< 0.002113< 0.0019-< 10
Molybdenumµg/L as Mo< 112< 1< 1< 1115< 0.05-< 1
Nickelmg/L as Ni< 112< 13.5< 11150.206-2
Potassiummg/L as K0.1265120.1160.3750.1321150.111-0.216
Seleniumµg/L as Se< 0.112< 0.10.13< 0.1115< 0.04-0.21
Silverµg/L as Ag< 0.0212< 0.02< 0.02< 0.02115< 0.005-0.058
Sodiummg/L as Na3.69123.377.781.781151.39-4.49
Strontiumµg/L as Sr15.81213.616.914.711513-19.7
Thalliumµg/L as Tl< 0.0112< 0.01< 0.01< 0.01115< 0.002-< 0.05
Tinµg/L as Sn< 512< 5< 5< 5115< 0.2-< 5
Titaniumµg/L as Ti< 512< 5< 5< 5115< 0.05-< 5
Uraniumµg/L as U< 0.112< 0.1< 0.1< 0.11150.00
Vanadiumµg/L as V< 512< 5< 5< 5115<0.2-<5
Zincµg/L as Zn< 512< 5< 5< 51150.37-54.1
Zirconiumµg/L as Zr< 0.112< 0.1< 0.1< 0.1115<0.1-<0.5
Coliforms, TotalCFU/100 mL< 1307< 12<12,471<1 - 200
E. coliCFU/100 mL< 1307< 1< 1<12,472<1 - <1
Hetero. Plate Count, 28C (7 day)CFU/1 mL< 1242< 0.01580< 102,253<1 - 770
Total Residual Chlorinemg/L as Cl21.982451.42.271.911,3960.8 - 2.33
Monochloraminemg/L as Cl21.882441.172.231.761,3810-3.09

Median is the middle of the measured values. The older comparison is a ten-year summary, not an additional 2025 sample. All result rows in the identified treated-water table are included. Raw-source water and distribution-system tables remain in the full linked report.

Capital Regional District · 2025 annual report ↗

These are dated public results for the locations shown, not a current test of your home. “<” means below the stated reporting limit, not zero. The linked reports contain the full results and laboratory notes. Sources checked September 13, 2026. Follow your supplier’s current notices and advisories.

Let’s find the right water system for your home.

Tell us what you’d like to improve. We’ll help you take the next step.

bottom of page